Features of the Daylight Evaluation Chart
The daylight evaluation chart (DEC) is a graphic representation of a pedestrian's field of view as he or she looks down a street and sweeps his or her view 90 degrees to the left or to the right.
Under special conditions, this view can be extended to 180 degrees horizontally as specified in Section 81-275 (Special conditions).
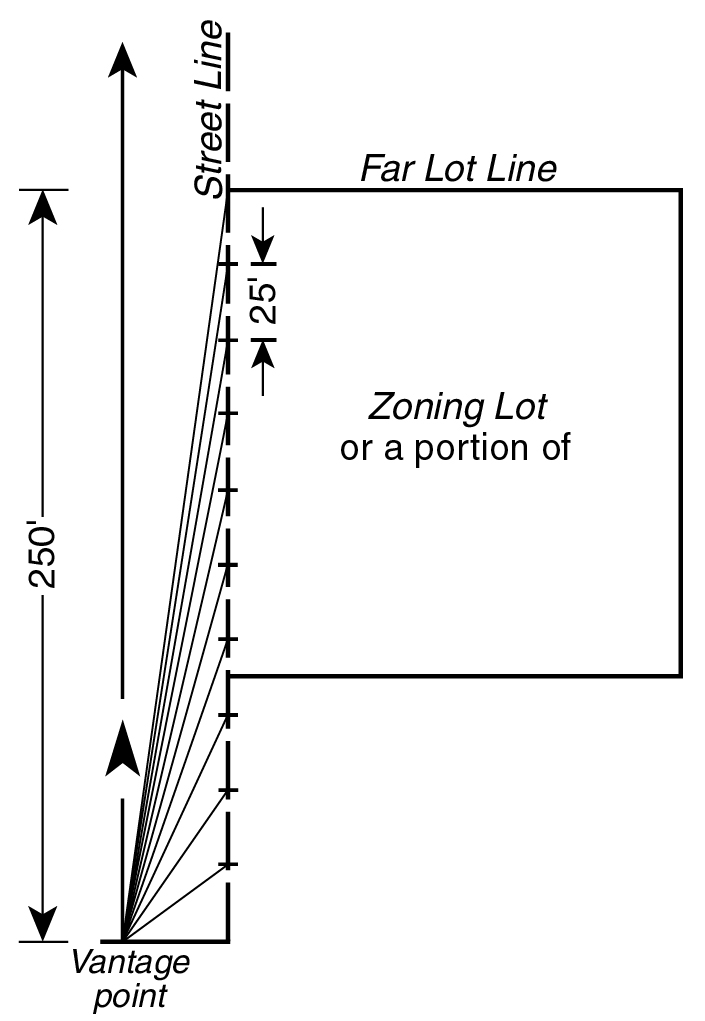
This pedestrian view is based on a vantage point located 250 feet from the intersection of the zoning lot's far lot line with the center line of the street.
There are three daylight evaluation charts for use with different Midtown street widths. They include a chart for 60-foot wide streets (for most east-west crosstown streets) as well as a chart for 75-foot or 80-foot wide streets and a chart for streets 100 feet or more in width (for avenues and major crosstown streets). All of these charts have the following features:
(a) Horizontal and vertical axes
The daylight evaluation chart has both a horizontal and vertical component, encompassing views sweeping both 90 degrees horizontally and 90 degrees vertically. (See illustration of Horizontal and Vertical Angles of View)
Under special conditions, this view can be extended to 180 degrees horizontally as specified in Section 81-275.
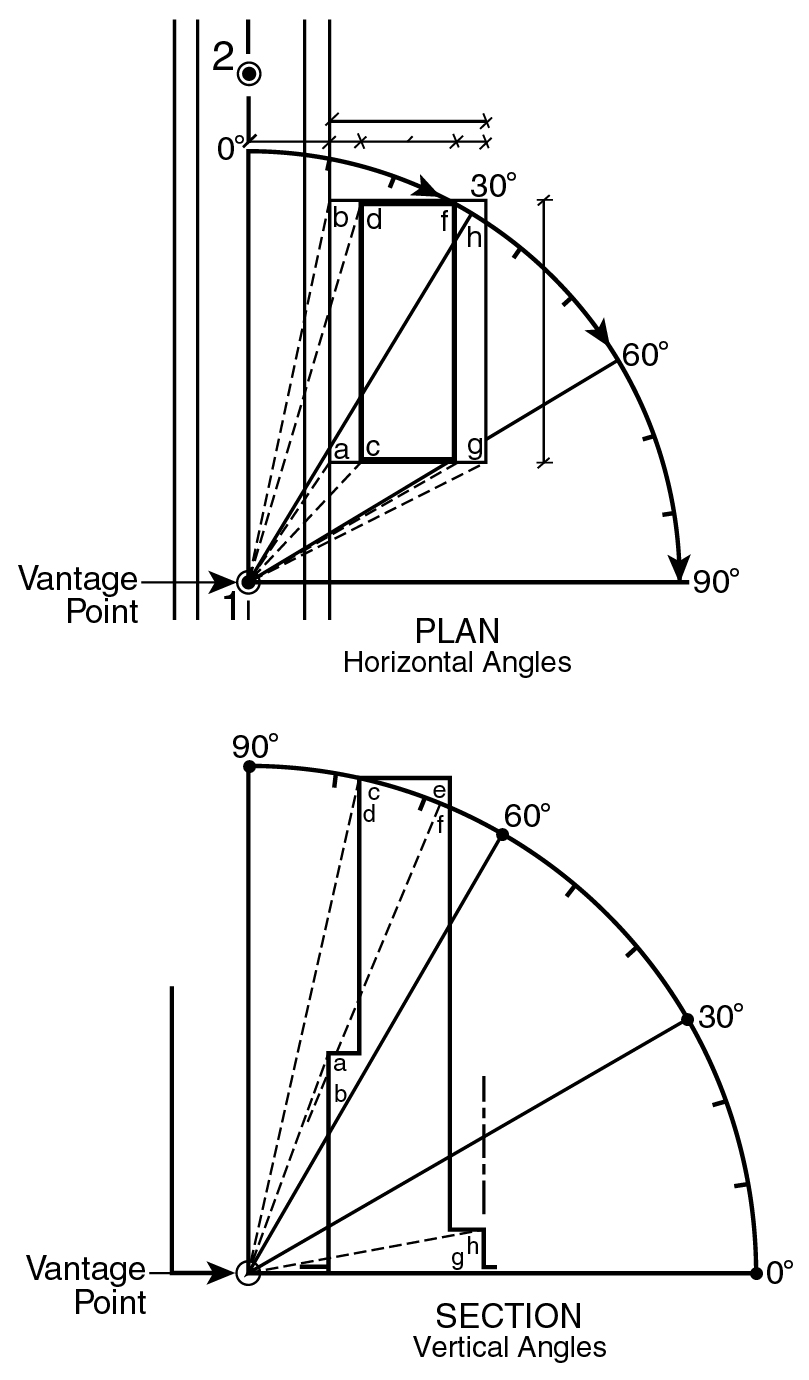
HORIZONTAL AND VERTICAL ANGLES OF VIEW
(81-272a.1)
The horizontal axis of the daylight evaluation chart is measured in degrees of arc from zero degrees to 90 degrees starting from the vantage point along the center line of the vantage street and sweeping toward the building.
The horizontal axis is intersected by vertical lines corresponding to lines of sight from the vantage point to points 25 feet apart on the front lot line along the vantage street measured from the intersection of the far lot line with the street line of the vantage street.
The vertical axis of the daylight evaluation chart is measured in degrees of arc from zero degrees to 90 degrees starting from the center line of the vantage street at curb level and sweeping upward.
The vertical axis is intersected by curved elevation lines representing elevation angles from the center line of the street at 10 degree intervals from zero degrees to 70 degrees and at two degree intervals from 70 degrees to 90 degrees. (See illustration of Horizontal and Vertical Axes)
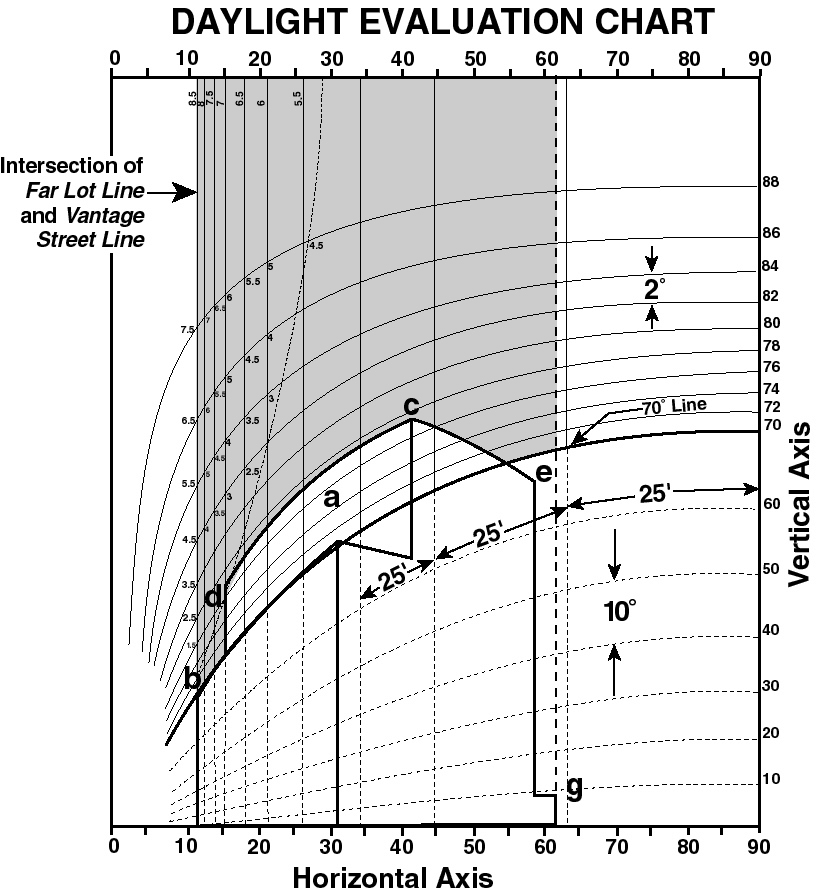
HORIZONTAL AND VERTICAL AXES
(81-272a.2)
(b) Daylight squares
The horizontal and vertical lines form a curvilinear grid dividing the daylight evaluation chart into areas called daylight squares. Above the 70 degree line, the grid is divided into 100 daylight squares starting from the vertical line rising from the intersection of the far lot line with the street line of the vantage street and ending at the vertical line representing 90 degrees along the horizontal axis. Each of these 100 squares represents 25 feet of lot frontage on the vantage street and two degrees of elevation angle from the center line of the vantage street.
Below 70 degrees, the grid is divided into 70 daylight squares starting from the vertical line rising from the intersection of the far lot line with the street line of the vantage street and ending at the vertical line rising at 90 degrees along the horizontal axis. Each of these 70 squares represents 25 feet of lot frontage on the vantage street and 10 degrees of elevation angle from the center line of the street. (See illustration of Daylight Squares)
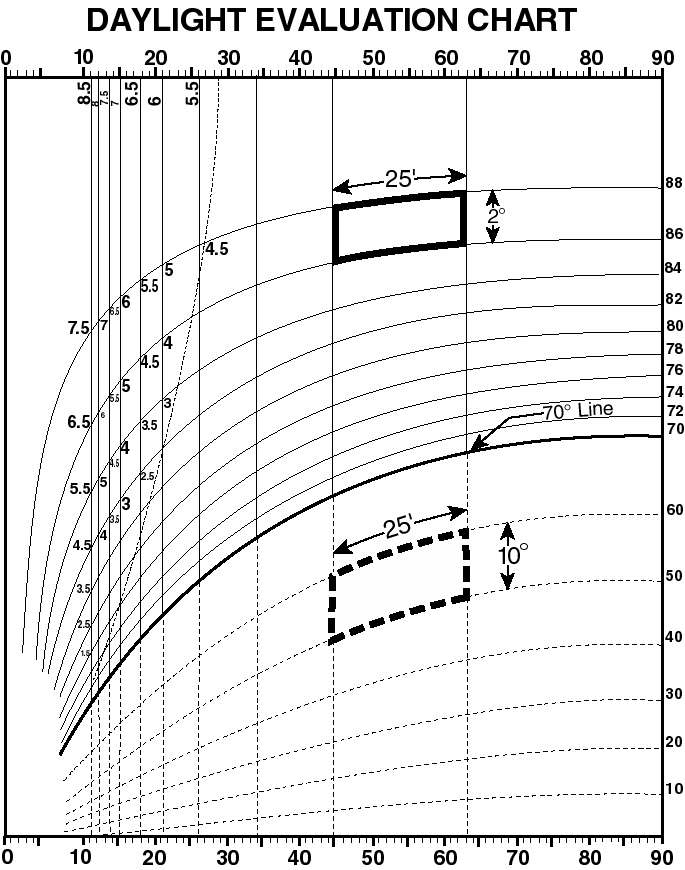
DAYLIGHT SQUARES
(81-272b)
(c) Daylight subsquares
For greater plotting and scoring precision, the horizontal axis of the grid is further subdivided by vertical lines at points five feet apart on the front lot line as seen from the vantage point. The vertical axis is further subdivided by curved lines representing lines of equal elevation at one degree intervals from 70 degrees to 90 degrees. Therefore, each daylight square is subdivided into 10 subsquares, each representing five feet of lot frontage on the vantage street and one degree of elevation angle from the center line of the vantage street. (See illustration of Daylight Squares and Subsquares Above 70 Degrees)
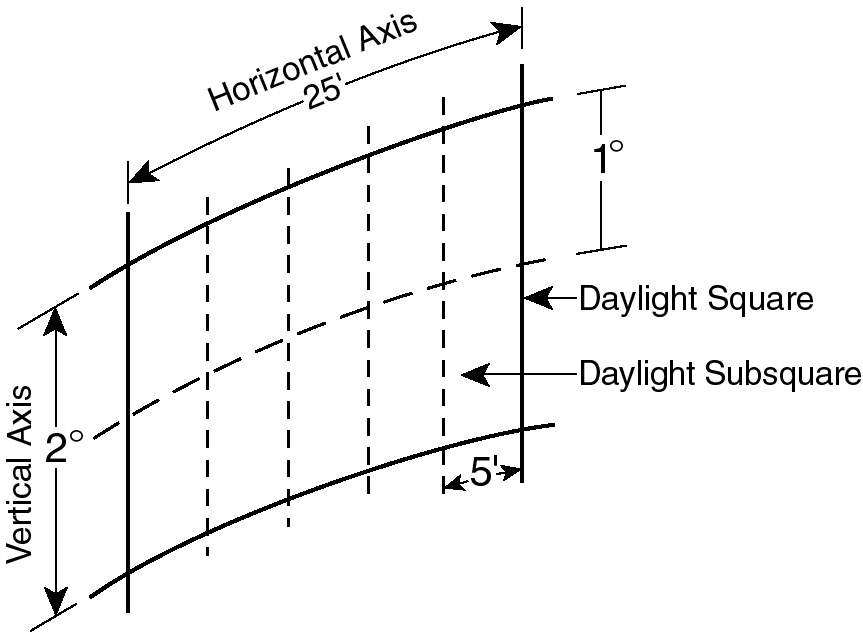
DAYLIGHT SQUARES AND SUBSQUARES ABOVE 70 DEGREES
(81-272c)
(d) The seventy degree line
Research shows that, as an average, 70 degrees is the elevation angle at which buildings in the Special Midtown District are set back from the street line. Most of the daylight below 70 degrees is blocked by such buildings. Slabs, towers or other setback portions of buildings rise to block an average of 25 percent of the available daylight squares above 70 degrees.
In building evaluation, the DEC measures the blocked sky above 70 degrees. Below 70 degrees, buildings are given credit for unblocked daylight.
(e) The profile curve
The grid is traversed by the profile curve, which rises from the intersection of the curved line representing an elevation angle of 72 degrees with the vertical line at the far lot line. The profile curve is derived from the predominant built character of developed Midtown streets as seen in profile. Encroachment across the profile curve is penalized to discourage canyon-like Midtown streets and to protect neighboring buildings.