Rules for plotting buildings on the daylight evaluation chart
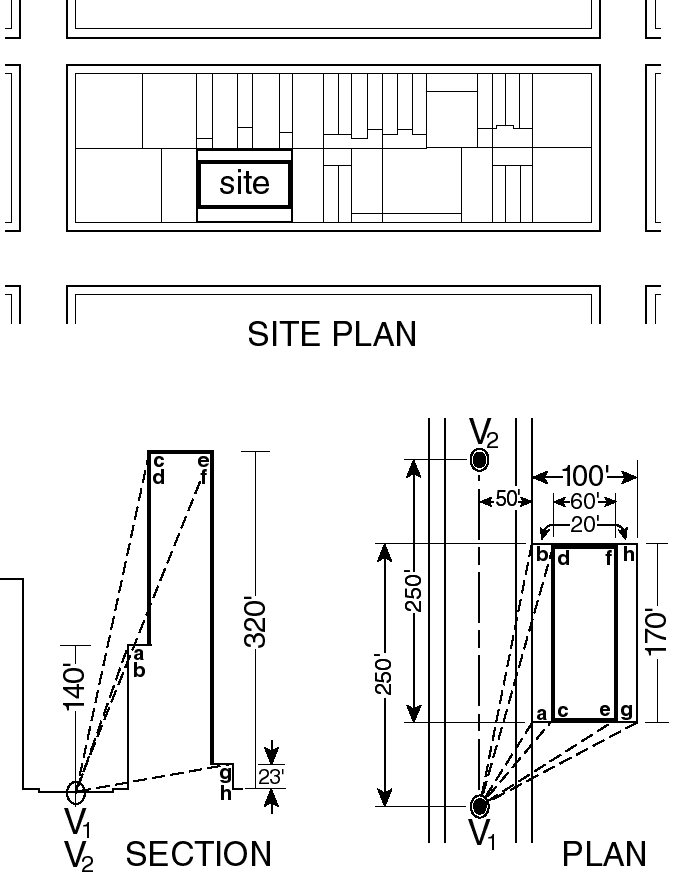
Evaluation of a development or enlargement requires drawing the new buildings, remaining buildings and open areas on the zoning lot on the appropriate daylight evaluation chart (DEC), as viewed from each required vantage point and then scoring the zoning lot. The rules for plotting buildings on the DEC are set forth in the following paragraphs of this Section and illustrated by an example of a building which fronts on a 100-foot wide street and occupies a site 170 feet long by 100 feet deep.
(a) Draw the building
Draw the building in plan showing all street frontages of the zoning lot. Draw the building in section perpendicular to each street on which the zoning lot fronts. On both plan and section drawings label all corners of the building. In the example they are labeled corners (a) through (h). (See illustrations of Example: Building Drawings)
EXAMPLE: BUILDING DRAWINGS
(81-273a)
(b) Establish vantage points
Establish on the plan all the vantage points from which views must be taken. Vantage points shall be established on the center line of the vantage street 250 feet from the intersection of the zoning lot's far lot line and the center line of the street. For each vantage street there are at least two vantage points. In the example, they are V1 and V2. For each vantage point there shall be a separate daylight evaluation chart. The example will use vantage point one.
(c) Record plan and section dimensions
Record on a coordinate chart for each corner of the building the following dimensions:
(1) Dimensions in plan:
The distance (S) between the corner and the center line of the street as measured along a line that intersects the center line of the street at right angles. In the example, distance (S) of corner (b) + 50 feet.
The distance (D) measured along the center line of the street from the vantage point to the point where the street center line is intersected by the perpendicular line from the corner. In the example, distance (D) of corner (b) + 250 feet.
(2) Dimension in section:
The height (H) of the corner above curb level. In the example, height (H) of corner (b) + 140 feet.
(d) Calculate plan and section angles
Determine the plan and section angles for each corner of the building as viewed from the vantage point.
(1) A plan angle is an angle on the plan formed at the vantage point by the line of sight to a corner of the building and the center line of the vantage street. The plan angle is found by calculating the tangent. The tangent is the quotient found by dividing distance (S) by distance (D). The plan angle for the resulting tangent is found in a tangent table and is then entered on the coordinate chart in the column marked "plan angles."
(2) The section angle is an angle formed by a line representing the distance in section from a corner of the building to the center line of the vantage street and a line representing the distance in plan (S) between the corner and the center line of the street. The section angle is found by calculating its tangent. The tangent is the quotient obtained by dividing the height of the corner (H) by its horizontal distance (S) from the center line of the street.
The section angle for the resulting tangent is found in a tangent table and is then entered on the coordinate chart in the column market "section angles."
EXAMPLE OF COORDINATE CHARTS
Plan Angles
Point | Distance (S) from Street Center Line (in feet) | Distance (D) from Vantage Point 1 (in feet) | Tangent (S÷D) of Angle | Angle |
a | 50 | 80 | 50/80 = 0.63 | 32.0o |
b | 50 | 250 | 50/250 = 0.20 | 11.3o |
c | 70 | 80 | 70/80 = 0.87 | 41.2o |
d | 70 | 250 | 70/250 = 0.28 | 15.6o |
e | 130 | 80 | 130/80 = 1.63 | 58.4o |
f | 130 | 250 | 130/250 = 0.52 | 27.5o |
g | 150 | 80 | 150/80 = 1.88 | 61.9o |
h | 150 | 250 | 150/250 = 0.60 | 31.0o |
Section Angles
Point | Height (H) Above Curb Level (in feet) | Distance (S) from Street Center Line (in feet) | Tangent (H÷S) of Angle | Angle |
a & b | 140 | 50 | 140/50 = 2.80 | 70.3o |
c & d | 320 | 70 | 320/70 = 4.57 | 77.7o |
e & f | 320 | 130 | 320/130 = 2.46 | 67.9o |
g & h | 23 | 150 | 23/150 = 0.15 | 8.7o |
(e) Plot corner coordinates
Plot each corner of the building onto the daylight evaluation chart at the point where the coordinates for that corner intersect. The plan angle coordinates are found on the horizontal axis of the chart and the section angle coordinates are found on the vertical axis. The points plotted are then connected to represent the edges of the building as shown on the plan and section drawings. A connecting line parallel to the street line of the vantage street is drawn as a curve parallel to the closest elevation line. A connecting line perpendicular to the street line of the vantage street is drawn parallel to the closest dotted elevation line, which is perpendicular to the street. A connecting line which is neither parallel nor perpendicular to the vantage street is approximated on the chart by:
(1) establishing points along the line in plan at 10-foot intervals;
(2) finding the coordinates of the points and plotting them on the chart; and
(3) connecting the resulting points.
The connecting lines produce a curvilinear perspective drawing of the building as seen from the vantage point projected onto the daylight evaluation chart. Since in the example vantage point one is on a 100 foot wide street, corner coordinates are plotted on a daylight evaluation chart for 100 foot wide streets. In the example, corner (b) is at the intersection of plan angle 11.3o and section angle 70.3o (See illustration of Building as Drawn on the Daylight Evaluation Chart)
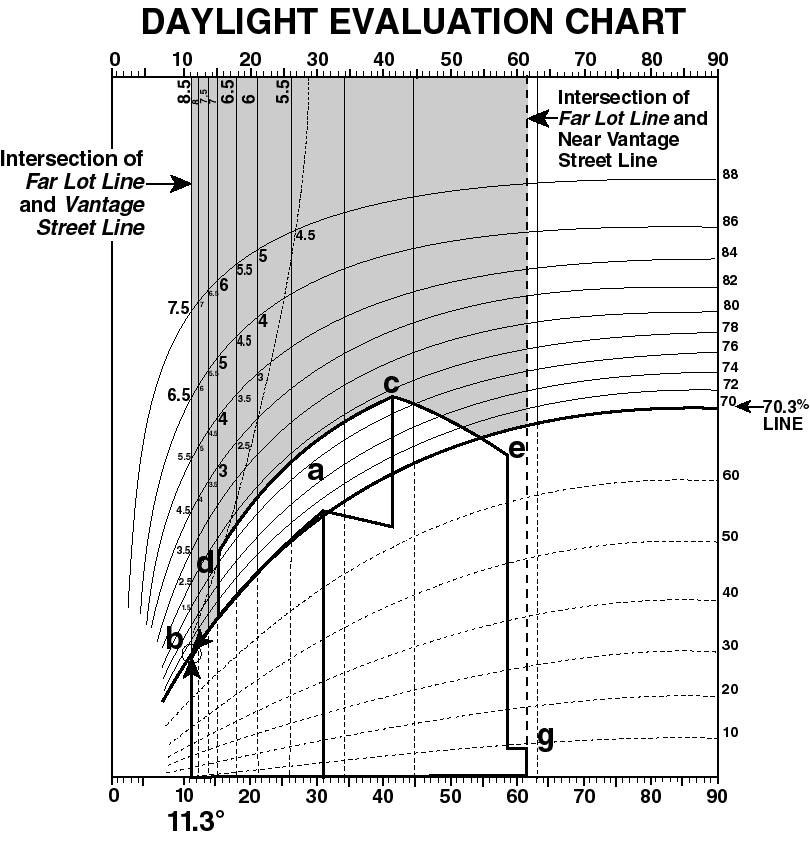
BUILDING AS DRAWN ON THE DAYLIGHT EVALUATION CHART
(81-273e)
(f) Determine daylight boundaries
Draw a vertical line on the chart rising from the intersection of the near lot line of the zoning lot with the center line of the block or with a line 100 feet distant from and parallel to the front lot line on the vantage street, whichever line is closer to the vantage street. This line and the far lot line represent the boundaries of the potential sky area that the building could block. (See illustration of Building as Drawn on the Daylight Evaluation Chart)